5 Innovative Financial Metrics for Businesses: From Startups to Enterprises

With enormous data made available to businesses in today’s business landscape, making data-driven decisions is crucial for success. The vast amount of financial data makes it overwhelming to determine which financial metrics to track.
Focusing on the right financial metrics can help businesses of all sizes and industries achieve their goals. For startups, small businesses, and large enterprises, tracking key financial indicators can provide invaluable insights into the company’s health and growth potential.
This comprehensive guide will explore the most impactful financial metrics that every business should monitor, regardless of size or industry.
The Evolution of Financial Metrics in the Digital Age
The concept of financial metrics isn’t new, but digital transformation has revolutionized how businesses collect, analyze, and utilize financial data.
Traditional metrics like revenue and profit margins remain important, but the rise of subscription-based models, e-commerce, and data-driven decision-making has introduced new, more nuanced metrics that provide deeper insights into business performance.
In the past, businesses relied heavily on lagging indicators – metrics that show what has already happened. Today, the focus has shifted towards leading indicators that can predict future performance. This shift allows companies to be more proactive in their decision-making processes.
Financial metrics meaning
Financial metrics are quantitative measures that are crucial for assessing a company’s financial health and performance. They provide a snapshot of a business’s financial health, helping businesses identify areas of strength and weakness.
They include various key performance indicators (KPIs) such as profitability, liquidity, efficiency, valuation, and leverage ratios.
These metrics help managers and financial professionals to track progress, inform strategy, and make data-driven decisions.
For instance, profitability metrics like net profit margin reveal how much profit a company makes for each dollar of revenue. On the other hand, liquidity metrics like the current ratio assess a company’s ability to meet short-term obligations.
Understanding these metrics is essential for stakeholders to evaluate the financial status and operational effectiveness of a business.
Made with Visme Infographic Maker
Why financial metrics matter
Financial metrics provide a snapshot of a company’s financial health, helping businesses identify areas of strength and weakness. By tracking the right metrics, businesses can:
- Make informed decisions: Financial metrics help businesses make data-driven decisions, reducing the risk of costly mistakes.
- Drive growth: By monitoring financial metrics, businesses can identify opportunities for growth and optimize their strategies.
- Improve efficiency: Financial metrics help businesses streamline operations, reduce waste, and optimize resource allocation.
- Enhance transparency: Regularly tracking financial metrics promotes transparency and accountability, fostering trust among stakeholders.
Financial metrics for businesses
Financial metrics are essential for businesses of all sizes and industries, providing valuable insights into financial performance and helping businesses make informed decisions.
- Revenue Growth: According to a survey by Deloitte, 75% of businesses consider revenue growth a top priority. (Deloitte’s 2022 Global CFO Survey)
- Gross Margin: McKinsey’s research highlights that companies with high gross margins (above 30%) are more likely to achieve long-term success. This is because higher gross margins provide companies with the financial flexibility to invest in growth opportunities, innovation, and other strategic initiatives.
- Customer Acquisition Cost (CAC): Customer Acquisition Cost (CAC) is a crucial metric for businesses to measure the efficiency and effectiveness of their marketing efforts. It helps companies understand the cost associated with acquiring new customers and is often used to evaluate marketing campaigns’ return on investment (ROI). (HubSpot’s 2022 State of Inbound Marketing report)
- Customer Experience: Customer experience (CX) drives customer loyalty and business success. According to Gartner, improving the product experience and enabling customers to self-affirm their purchase decisions can build lasting customer loyalty.
- Cashflow: A study by CB Insights found that 29% of startups fail due to cash flow problems. (CB Insights’ report)
SaaS financial metrics
SaaS (Software as a Service) companies can benefit from tracking financial metrics, such as gross margin ratio, CAC, CLV, and burn rate, to evaluate their financial performance and make informed decisions about pricing, customer acquisition, and customer retention.
The following are notable SaaS financial metrics according to studies and reports.
- The average revenue growth rate for SaaS companies is around 20-30% per year. (SaaS Capital’s Survey)
- Finmark’s 2022 benchmark reports that the median gross margin percentage for SaaS companies is around 70-80%.
- The average CAC for SaaS companies is generally reported to be around $702 according to Userpilot’s 2024 benchmark report.
- CLV is a critical metric for understanding customer profitability over time. This is because the SaaS model thrives on recurring revenue. CLV is therefore an indispensable metric for forecasting growth, strategizing customer retention, and justifying marketing investments (SaaS Launchr).
- The average burn rate for SaaS companies can vary, but a commonly cited benchmark is around 10-20% per month. This means that, on average, SaaS companies spend 10-20% of their cash reserves each month (Scale Studio).
5 Innovative Financial Metrics for Business Success
Balancing innovation with financial discipline is key; it involves strategic investment and focusing on new ideas that promote financial health. Entrepreneurs should regularly track essential financial metrics to understand their business operations better and make informed decisions.
Let’s track 5 invaluable financial metrics every business should not ignore.
1. Customer Acquisition Cost (CAC) to Lifetime Value (LTV) Ratio
The CAC to LTV ratio is a critical metric, especially for startups and growth-focused companies.
It measures the relationship between the cost of acquiring a new customer and the revenue that customer generates over their lifetime.
CAC includes all marketing and sales expenses divided by the number of new customers acquired in a given period.
LTV represents the total revenue a business can expect from a single customer account throughout the business relationship. Learn how to compute this here.
The ideal CAC:LTV ratio is typically 1:3 or better, meaning the lifetime value of a customer should be at least three times the cost of acquiring them (Saasmetrics).
This ratio indicates a healthy and sustainable business model, where the returns from customers significantly outweigh the costs to acquire them. This ensures that your customer acquisition strategy is sustainable and profitable in the long run.
Why does it matter?
This metric helps businesses understand the efficiency of their marketing and sales efforts. A high ratio indicates that you’re spending too much to acquire customers relative to their value, which can lead to unsustainable growth.
2. Cash Burn Rate and Runway
Cash burn rate is the pace at which a company is spending its cash reserves on operations. This metric is particularly crucial for startups and businesses in growth phases that may not yet be profitable.
Burn Rate: Calculated as the amount of cash the company spends per month to cover operating expenses.
Runway: The amount of time a company has before it runs out of cash, assuming the current burn rate and no additional funding.
Learn how to calculate burn rate and runaway in the following resources:
Why does it matter?
Understanding your burn rate and runway is essential for financial planning, especially for startups. It helps determine when you need to raise additional funds, cut costs, or reach profitability to ensure the company’s survival and growth.
3. Net Revenue Retention (NRR)
Net Revenue Retention is a key metric for subscription-based businesses and SaaS companies. It measures the percentage of recurring revenue retained from existing customers over time, including expansions, upgrades, downgrades, and churn.
A Net Revenue Retention rate over 100% indicates that your revenue from existing customers is growing, even accounting for churn.
Why does it matters?
NRR is a strong indicator of product-market fit and customer satisfaction. High NRR suggests that customers find ongoing value in your product or service, leading to increased usage and upgrades over time.
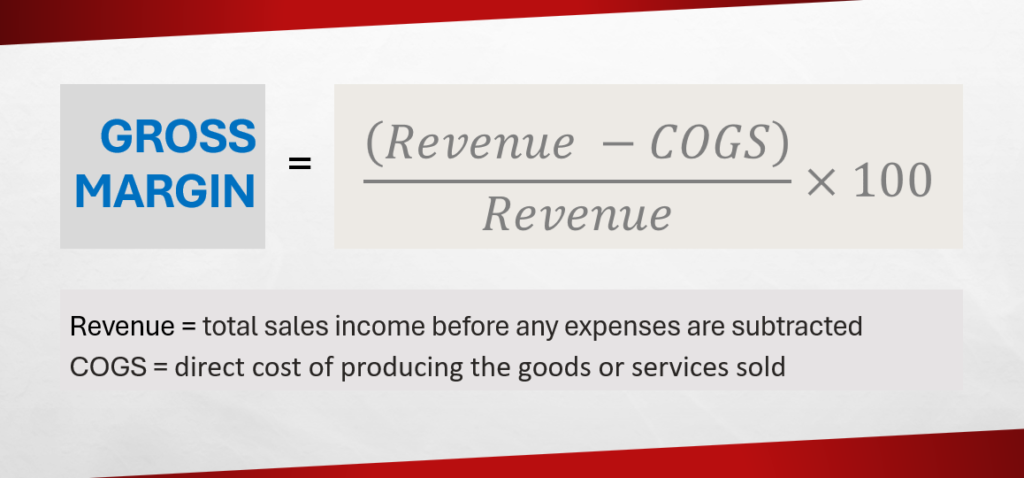
4. Gross Margin
Gross margin is a fundamental metric that measures the profitability of your core business operations. It represents the percentage of revenue that exceeds the cost of goods sold (COGS).

Why does it matter?
Gross margin helps you understand how efficiently you’re producing your product or delivering your service. A higher gross margin indicates better efficiency and gives you more resources to invest in growth, research and development, or to improve profitability.
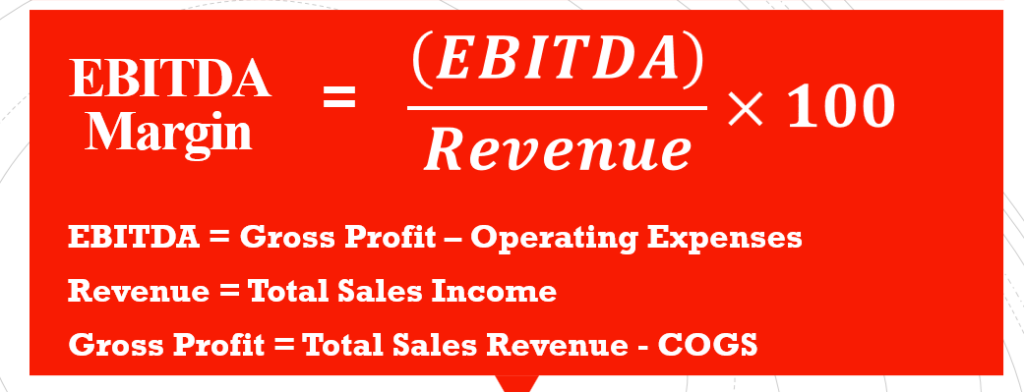
5. EBITDA Margin
EBITDA (Earnings Before Interest, Taxes, Depreciation, and Amortization) margin is a measure of a company’s operating profitability as a percentage of its total revenue.

Why does it matters?
EBITDA margin provides insights into a company’s operational efficiency and profitability before the influence of financial and accounting decisions. It’s often used to compare companies within the same industry, as it eliminates the effects of financing and capital expenditures.
Building Your Financial Metrics Dashboard
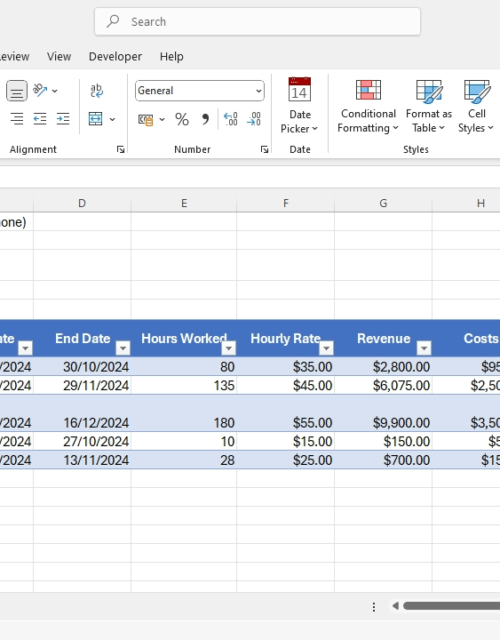
Creating a financial metrics dashboard is crucial for monitoring your business’s health at a glance. Modern businesses use various tools to build these dashboards, from sophisticated Business Intelligence (BI) platforms (e.g. Power BI, Tableau) to simpler spreadsheet-based solutions.
Key components of an effective financial metrics dashboard include:
- Real-time data updates
- Visualizations (charts, graphs) for easy interpretation
- Customizable views for different stakeholders
- Benchmarking against industry standards or historical performance
- Alerts for metrics that fall outside predetermined ranges
When building your dashboard, focus on the metrics that are most relevant to your business model and growth stage.
For startups, this might mean emphasizing CAC, LTV, and burn rate, while more established businesses might focus more on EBITDA and gross margins.
Balancing Financial and Non-Financial Metrics
While financial metrics are crucial, they don’t tell the whole story of a business’s health and potential.
Non-financial metrics can provide additional context and insights that complement financial data.
Some important non-financial metrics include:
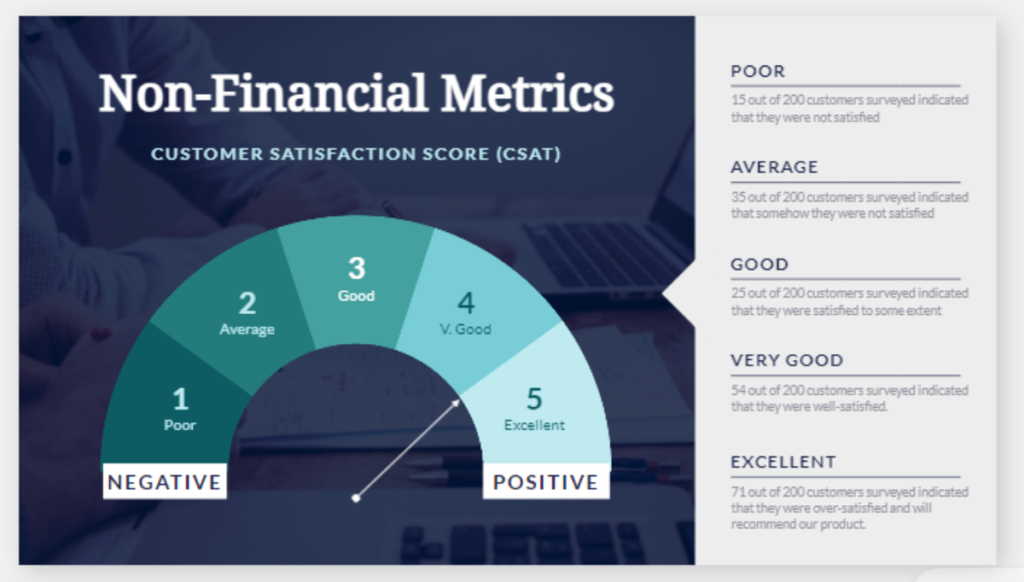
Customer Satisfaction Score (CSAT)
The Customer Satisfaction Score (CSAT) is a key performance metric used to gauge how satisfied customers are with a product, service, or experience. It is typically measured through customer feedback surveys that ask respondents to rate their satisfaction on a scale, often from 1 (very unsatisfied) to 5 (very satisfied).

The scores from the top two positive responses (4 and 5) are then used to calculate the percentage of satisfied customers. This metric provides immediate feedback on customer sentiment and can be a crucial indicator of potential repeat business and customer loyalty.
CSAT = Total Positive Responses x 100 / Total Responses
A good CSAT score falls between 75% and 85% (Hubspot)
Employee Engagement and Retention
Employee engagement and retention are critical metrics for assessing organizational health and workforce stability. Engagement refers to the emotional commitment an employee has towards their organization and its goals, which can significantly impact their performance and willingness to go above and beyond.
Retention measures the ability of an organization to retain its employees over time, which is essential for maintaining institutional knowledge and reducing recruitment costs.
Effective strategies to enhance these metrics include fostering a positive work environment, providing growth opportunities, and recognizing employee contributions, all of which contribute to a more committed and stable workforce.
There are different employee engagement metrics a business can track, including voluntary employee turnover rate, employee satisfaction, absenteeism, Employee Net Promoter Score (eNPS), etc.
For example, voluntary employee turnover rate can be calculated thus,

Lower voluntary turnover rates and higher eNPS indicate better engagement and retention.
Product Quality Metrics
Product quality metrics are essential tools for assessing the performance and effectiveness of a product. They provide objective data that can help organizations understand how well they are meeting their goals and standards.
Key performance indicators (KPIs) such as Net Promoter Score (NPS), Customer Retention Rate, and Defects Per Million (DPM) offer insights into customer satisfaction, product reliability, and overall quality.
By tracking these metrics, companies can identify areas for improvement and ensure their products meet the high standards expected by consumers.
For example, NPS can be calculated using the formula:
NPS = (Promoters – Detractors) x 100 / (Promoters + Detractors + Passives)
Positive NPS is a good result, but if the number is going down over time, then there might be a problem business your business and its customers.
Innovation Metrics (e.g., new product development cycle time)
Innovation metrics measure the ability of a company to develop and launch new products or services.
Innovation metrics, such as new product development cycle time, are crucial for gauging the efficiency and effectiveness of an organization’s innovation processes.
Innovation metrics are typically calculated by tracking key performance indicators (KPIs) such as time-to-market, research and development (R&D) expenses, and return on innovation investment (ROI).
Time to market metric measures the time it takes for a product to move from conception to market launch. A shorter development cycle can indicate a more agile and responsive organization, capable of quickly adapting to market changes and customer needs.
However, it’s important to balance speed with quality and to ensure that the rapid development of new products does not compromise their performance or safety.
Sustainability and Corporate Social Responsibility (CSR) Metrics
Sustainability metrics are diverse and aim to quantify the environmental, social, and economic aspects of sustainability.
Sustainability and CSR metrics measure the social and environmental impact of a company’s operations. They are typically calculated by tracking KPIs such as carbon footprint, water usage, waste reduction, and community engagement.
Lower carbon footprint and higher community engagement indicate better sustainability and CSR efforts
The balanced scorecard approach, developed by Robert Kaplan and David Norton, provides a framework for integrating financial and non-financial metrics. It suggests looking at a business from four perspectives:
- Financial perspective: Measures financial performance and assesses if the company’s strategy contributes to the bottom line. Common metrics include ROI, cash flow, and profit margins.
- Customer perspective: Evaluates customer satisfaction and retention. Key metrics include customer satisfaction scores, retention rates, and market share.
- Internal business processes perspective: Focuses on the efficiency and effectiveness of internal processes. Metrics might include cycle time, production costs, and defect rates.
- Learning and growth perspective: Focuses on the efficiency and effectiveness of internal processes. Metrics might include cycle time, production costs, and defect rates.
By considering both financial and non-financial metrics, businesses can gain a more holistic view of their performance and potential for long-term success.
Implementing Financial Metrics in Small Businesses and Startups
For small businesses and startups, implementing a comprehensive financial metrics tracking system can seem daunting. However, starting small and focusing on the most relevant metrics can provide significant benefits without overwhelming resources.
Here are some tips for small businesses and startups:
- Start with the basics: Focus on cash flow, profitability, and growth metrics.
- Utilize affordable tools: Many cloud-based accounting and analytics tools offer affordable plans for small businesses. Platforms such as Zoho Books and wave accounting can help.
- Educate your team: Ensure everyone understands the key metrics and their importance.
- Set realistic benchmarks: Compare your performance to similar-sized companies in your industry.
- Review regularly: Set up monthly or quarterly reviews to analyze your metrics and adjust strategies accordingly.
Remember, the goal is to use these metrics to make informed decisions and drive growth, not to get bogged down in data collection and analysis.
The Future of Financial Metrics: AI and Predictive Analytics
As we look to the future, artificial intelligence (AI) and machine learning are set to revolutionize how businesses use financial metrics.
Predictive analytics, powered by AI, can forecast future performance based on historical data and external factors.
Some emerging trends in financial metrics include:
- Real-time metric updates and alerts – enable businesses to respond swiftly to market changes.
- Automated data collection and analysis – streamline processes, ensuring accuracy and efficiency.
- Predictive cash flow forecasting – leverages historical data and machine learning to anticipate future financial scenarios.
- AI-driven customer behavior analysis for more accurate LTV predictions – it sharpens lifetime value predictions.
- Integrated financial and operational metrics for a more comprehensive view of business performance
These advancements will allow businesses to be more proactive in their decision-making, identifying potential issues before they become critical and capitalizing on opportunities faster than ever before.
Conclusion
In today’s data-driven business environment, understanding and effectively utilizing financial metrics is no longer optional – it’s a necessity for success. From startups to established enterprises, the right set of metrics can provide invaluable insights, guide decision-making, and drive sustainable growth.
By focusing on key metrics like the CAC to LTV ratio, cash burn rate, net revenue retention, gross margin, and EBITDA margin, businesses can gain a comprehensive view of their financial health and growth potential. Balancing these financial metrics with non-financial indicators provides a holistic picture of overall business performance.
Remember, the goal isn’t just to collect data, but to use it to make informed decisions that drive your business forward. Start by implementing a few key metrics relevant to your business model and growth stage, then expand and refine your approach as your understanding and needs evolve.
As we move into an era of AI-driven analytics and predictive modeling, the businesses that master the art and science of financial metrics will be best positioned to thrive in an increasingly competitive landscape. Whether you’re a startup founder, a small business owner, or a corporate executive, making financial metrics a cornerstone of your strategy is a crucial step toward long-term success and sustainability.


